Note
Go to the end to download the full example code.
Raman: fused silica’s response#
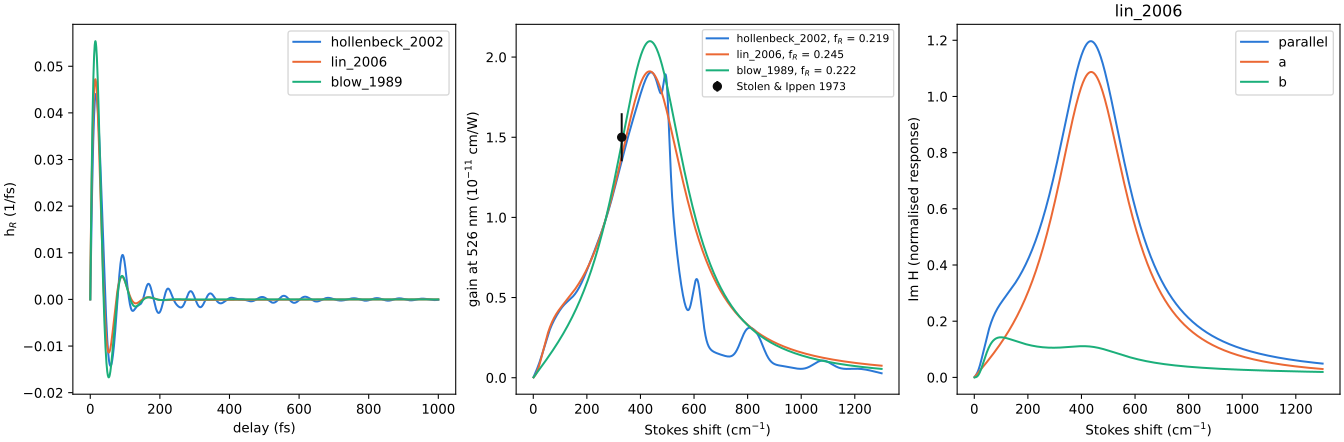
Fused silica’s Raman models (optmat.solid.raman_response.silica_raman_response()).
Left: the normalised responses \(h_R(t)\): Hollenbeck & Cantrell’s 13 modes (the default), Lin & Agrawal’s two-part form and Blow & Wood’s single oscillator. Hollenbeck & Cantrell’s has the measured response’s phase reversal near 160 fs and recurrence near 500 fs (their Fig. 7); the other two only decay.
Centre: the copolarised Stokes gain for a 526 nm pump, each model with its own \(f_R\) and optmat’s long-pulse \(n_2\) (the Kerr fit), against Stolen & Ippen’s measured gain of fused quartz at 330 cm-1 (TC-693). The Kerr fit takes that gain as data, so the default’s \(f_R = 0.219\) is set by it (TC-696).
Right: Lin & Agrawal’s isotropic part \(a\) and anisotropic part \(b\) of the gain. The anisotropic part, from the Boson peak, carries the low-frequency shoulder; a probe polarised across the pump sees only \(b/2\) of the gain (their Eq. (1)).
import math
import warnings

import matplotlib.pyplot as plt
import numpy as np
from _helpers import COLOURS

from optmat.constants import C
from optmat.datasets import datasets
from optmat.exceptions import ModelRangeWarning
from optmat.solid.raman_response import silica_raman_response, silica_raman_responses

warnings.simplefilter("ignore", ModelRangeWarning)
WAVENUMBER = 2 * math.pi * C * 100
fig, axes = plt.subplots(1, 3, figsize=(14, 4.6), layout="constrained")

t = np.linspace(0.0, 1e-12, 4001)
shift = np.linspace(1.0, 1300.0, 2600)
for colour, (name, model) in zip(
    COLOURS, silica_raman_responses().items(), strict=False
):
    axes[0].plot(t * 1e15, model.response(t) * 1e-15, color=colour, label=name)
    gain = model.gain(526e-9, shift * WAVENUMBER) * 100 * 1e11
    axes[1].plot(
        shift, gain, color=colour, label=f"{name}, f$_R$ = {model.raman_fraction:.3f}"
    )
axes[0].set_xlabel("delay (fs)")
axes[0].set_ylabel("h$_R$ (1/fs)")
axes[0].legend()

(stolen,) = (
    d
    for d in datasets("SiO2", quantity="raman_gain")
    if d.key == "stolen_1973/gain_amplifier"
)
axes[1].errorbar(
    [float(str(stolen.parameters["shift_cm1"]))],
    stolen.scaled_values() * 1e11,
    yerr=stolen.standard_uncertainty() * 1e11,
    fmt="o",
    color="#0b0b0b",
    label="Stolen & Ippen 1973",
)
axes[1].set_xlabel("Stokes shift (cm$^{-1}$)")
axes[1].set_ylabel("gain at 526 nm (10$^{-11}$ cm/W)")
axes[1].legend(fontsize=8)

lin = silica_raman_response("lin_2006")
for colour, component in zip(COLOURS, ("parallel", "a", "b"), strict=False):
    part = np.imag(lin.spectrum(shift * WAVENUMBER, component))
    axes[2].plot(shift, part, color=colour, label=component)
axes[2].set_xlabel("Stokes shift (cm$^{-1}$)")
axes[2].set_ylabel("Im H (normalised response)")
axes[2].set_title("lin_2006")
axes[2].legend()
plt.show()
Total running time of the script: (0 minutes 0.580 seconds)