Note
Go to the end to download the full example code.
Robustness: leaving one dataset out#
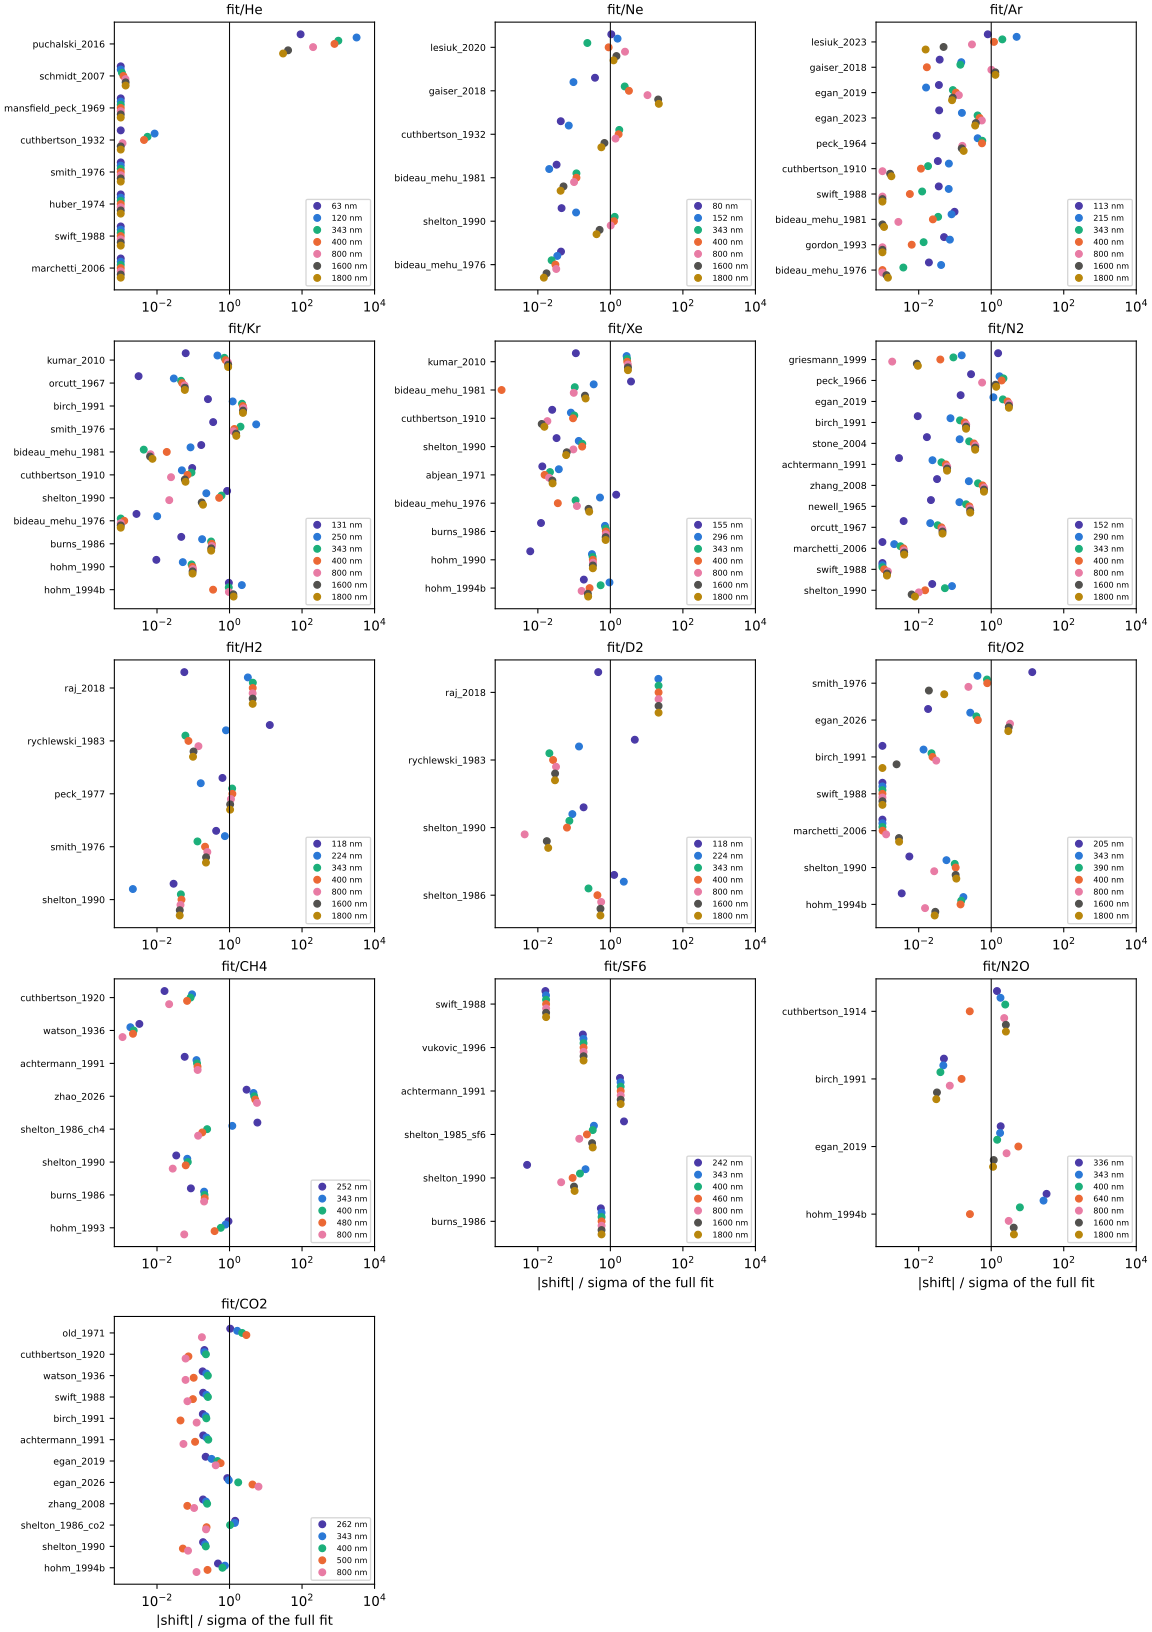
Each fit refitted without each of its datasets in turn (tools/fit/robustness.py,
stored in data/gas/models/robustness): the change of the polarizability at five
wavelengths across the model’s range, in units of the full fit’s one-sigma uncertainty.
A dataset whose removal moves the model by much more than one sigma determines the model
there on its own. For the backbones (the ab initio moments of helium, neon and argon,
the dielectric static values) that is by design. Two levels rest on one metrology value
each: hydrogen’s on Achtermann’s (-870 ppm without it) and oxygen’s on Birch’s (-840
ppm), where the band understates the uncertainty of the level (TC-101).
Each refit starts from the full solution and follows it to the nearest minimum, so the shifts measure the dataset and not the optimiser.
import json

import matplotlib.pyplot as plt
import numpy as np

from optmat.gas import GAS_DATA_DIRECTORY

GASES = [
    *("He", "Ne", "Ar", "Kr", "Xe"),
    *("N2", "H2", "D2", "O2", "CH4", "SF6", "N2O", "CO2"),
]
FLOOR = 1e-3  # smaller shifts are drawn at the left edge
# Up to seven wavelengths per record (two near the short end, 343-1800 nm).
COLOURS = [
    *("#4a3aa7", "#2a78d6", "#1baf7a", "#eb6834"),
    *("#e87ba4", "#52514e", "#b8860b"),
]
records = {
    gas: json.loads(
        (GAS_DATA_DIRECTORY / "models" / "robustness" / f"{gas}.json").read_text(
            encoding="utf-8"
        )
    )
    for gas in GASES
}

fig, axes = plt.subplots(5, 3, figsize=(12, 17), layout="constrained")
for ax in axes.flat[len(GASES) :]:
    ax.set_visible(False)
for ax, gas in zip(axes.flat, GASES, strict=False):
    record = records[gas]
    keys = list(record["dropped"])
    centre = (len(record["wavelength_nm"]) - 1) / 2
    for column, wavelength in enumerate(record["wavelength_nm"]):
        shifts = [record["dropped"][key]["shift_sigma"][column] for key in keys]
        ax.plot(
            np.clip(np.abs(shifts), FLOOR, None),
            np.arange(len(keys)) + 0.1 * (column - centre),
            "o",
            ms=5,
            color=COLOURS[column],
            label=f"{wavelength:.0f} nm",
        )
    sources = [key.split("/")[0] for key in keys]
    labels = [
        key.replace("/", ":\n") if sources.count(source) > 1 else source
        for key, source in zip(keys, sources, strict=True)
    ]
    ax.set_yticks(range(len(keys)), labels, fontsize=7)
    ax.set_xscale("log")
    ax.set_xlim(FLOOR / 1.5, 1e4)
    ax.axvline(1, color="#0b0b0b", lw=0.8)
    ax.invert_yaxis()
    ax.set_title(f"fit/{gas}", fontsize=10)
    ax.legend(fontsize=6, loc="lower right")
for ax in axes.flat[len(GASES) - 3 : len(GASES)]:  # the bottom of each column
    ax.set_xlabel("|shift| / sigma of the full fit")
plt.show()
Total running time of the script: (0 minutes 2.449 seconds)