Note
Go to the end to download the full example code.
The second hyperpolarizability: every process on one curve#
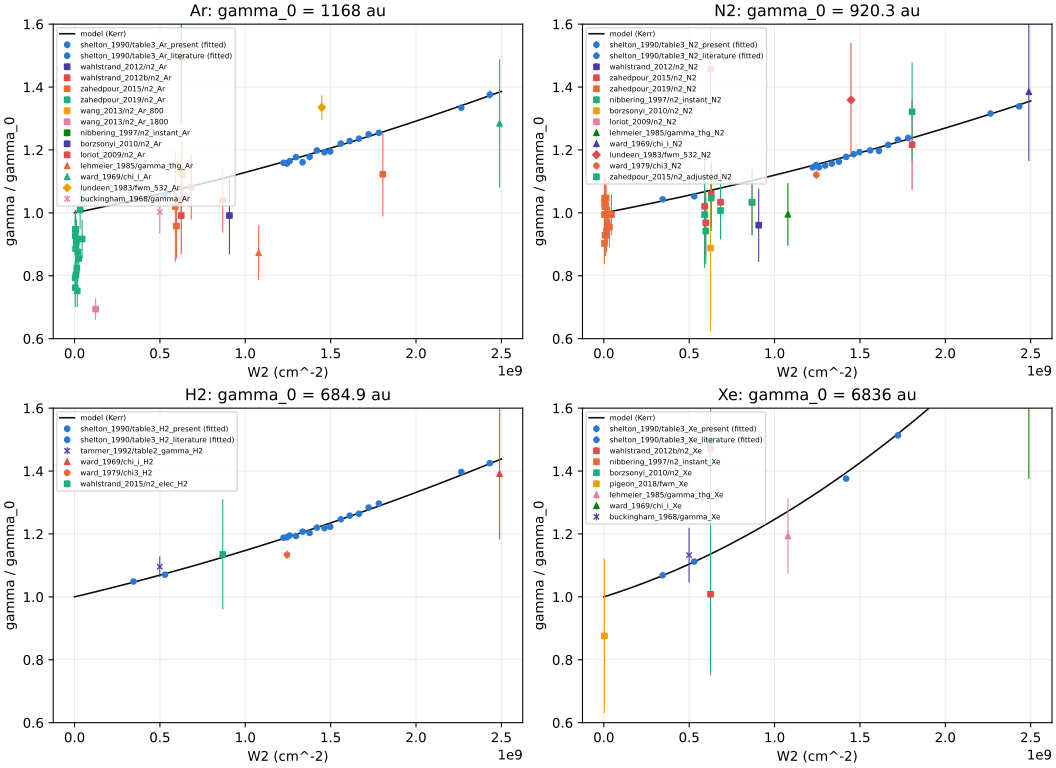
For each gas, gamma / gamma_0 of the fitted model (line, the Kerr process) against the dispersion variable W2 = sum of the squared wavenumbers of the four frequencies. The data of every process are shown against their own W2:
the fitted ESHG (circles);
the validators: measured n2 as the Kerr gamma (squares), third-harmonic generation (triangles), CARS (diamonds), dc Kerr (crosses).
Because gamma depends on the frequencies almost only through W2 (Bishop; Shelton), one curve serves every process; the small B’ term separates them at fourth order. The measured n2 lie 1-15 % below the ESHG-based curve, and Lehmeier’s THG up to 31 % below (see the Third-order nonlinearity page).
import matplotlib.pyplot as plt
import numpy as np
from _helpers import COLOURS, LINE_COLOURS

from optmat.datasets import datasets
from optmat.exceptions import DataError
from optmat.gas.gases import Gas
from optmat.gas.nonlinear import (
    gamma_observation,
    hyperpolarizability_models,
    load_nonlinear_config,
)

GASES = [Gas.Ar, Gas.N2, Gas.H2, Gas.Xe]
MARKERS = {"eshg": "o", "pump_probe": "s", "kerr": "s", "thg": "^", "cars": "D"}
models = hyperpolarizability_models()
by_key = {d.key: d for d in datasets()}

fig, axes = plt.subplots(2, 2, figsize=(11, 8), layout="constrained")
for axis, gas in zip(axes.flat, GASES, strict=True):
    model = models[gas]
    gamma0 = model.parameters[0]
    w2 = np.linspace(0.0, 2.5e9, 200)
    wavelength = np.where(w2 > 0, 2.0 / np.sqrt(np.maximum(w2, 1e-30)) * 1e-2, np.inf)
    curve = model.gamma_au("kerr", wavelength) / gamma0
    axis.plot(w2, curve, color=LINE_COLOURS[0], linewidth=1.2, label="model (Kerr)")
    config = load_nonlinear_config(gas.value)
    config_keys = [(o, True) for o in config.fitted] + [
        (o, False) for o in config.validators
    ]
    for index, (options, fitted) in enumerate(config_keys):
        if options.scale_group or options.free_scale:
            continue  # theory with a free scale: shape only
        try:
            obs = gamma_observation(by_key[options.key], options)
        except DataError:
            continue
        keep = obs.w2 <= 2.5e9
        if not np.any(keep):
            continue
        marker = "x" if obs.process == "dc_kerr" else MARKERS.get(obs.process, "v")
        axis.errorbar(
            obs.w2[keep],
            obs.gamma[keep] / gamma0,
            yerr=obs.sigma[keep] / gamma0,
            fmt=marker,
            color=COLOURS[0] if fitted else COLOURS[1 + index % 7],
            markersize=4,
            linewidth=0.8,
            label=options.key if not fitted else options.key + " (fitted)",
        )
    axis.set_title(f"{gas.value}: gamma_0 = {gamma0:.4g} au")
    axis.set_xlabel("W2 (cm^-2)")
    axis.set_ylabel("gamma / gamma_0")
    axis.set_ylim(0.6, 1.6)
    axis.grid(alpha=0.25)
    axis.legend(fontsize=5.5, loc="upper left")
Total running time of the script: (0 minutes 1.528 seconds)