Note
Go to the end to download the full example code.
Ionisation: the rates of molecules#
optmat’s rate of molecules and the forms of the literature
(optmat.gas.molecular_ionisation_rates.molecular_rate_model()).
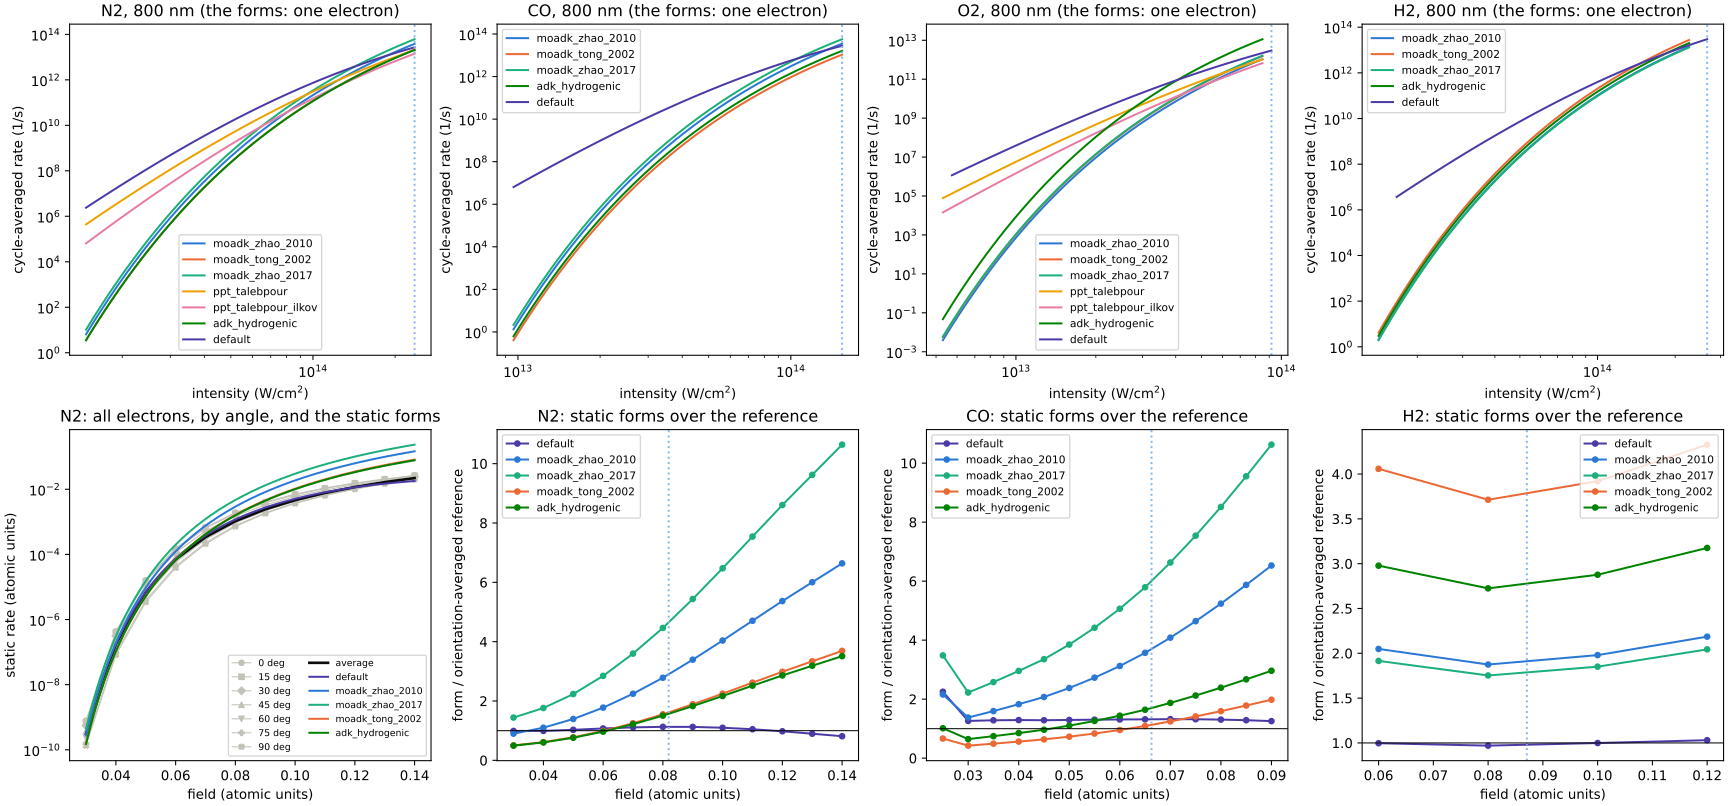
Top: the cycle-averaged rate at 800 nm for N2, CO, O2 and H2: the default (of the molecule) and each form (of one electron), up to the barrier-suppression field of a Coulomb potential (dotted). For O2 the hydrogen-like form, which knows the ionisation energy alone, is an order of magnitude above the forms that know the orbital or were fitted to yields.
Bottom left: the all-electron static rates of N2 of Majety and Scrinzi (2015) at
seven angles between the field and the axis, their average over orientations
(optmat.gas.molecular_ionisation_validation.orientation_average(), black) and
the static forms.
Bottom, the other three: the default at fixed nuclei, and each static form, over the orientation average, for N2, CO and H2. The default’s correction and count were fitted to the references of N2 and H2 (TC-678), O2’s and CH4’s to Jagau’s (2018) coupled-cluster rates (TC-698); CO, which takes N2’s correction without a fit, tests it: the default is a constant 1.3 times its reference (TC-683). Without a correction at finite field the forms rise against the reference as the field does; for H2 the molecular tunnelling rate is two to four times too high at every field (TC-673).
import warnings
from dataclasses import replace

import matplotlib.pyplot as plt
import numpy as np
from _helpers import COLOURS, MARKERS
from matplotlib.ticker import NullFormatter

from optmat.constants import AU_ANGULAR_FREQUENCY, AU_FIELD, EPS0, C
from optmat.exceptions import ModelRangeWarning
from optmat.gas.molecular_ionisation_rates import (
    molecular_rate_model,
    molecular_rate_models,
)
from optmat.gas.molecular_ionisation_validation import orientation_averaged_rates

STATIC = (
    "default",
    "moadk_zhao_2010",
    "moadk_zhao_2017",
    "moadk_tong_2002",
    "adk_hydrogenic",
)
COLOUR = dict(zip(molecular_rate_models(), COLOURS, strict=False))

fig, axes = plt.subplots(2, 4, figsize=(18, 8.4), layout="constrained")
for axis, gas in zip(axes[0], ("N2", "CO", "O2", "H2"), strict=True):
    for name, by_gas in molecular_rate_models().items():
        if not any(key.value == gas for key in by_gas):
            continue
        model = molecular_rate_model(gas, 800e-9, name)
        field = np.geomspace(0.25, 1.0, 120) * model.barrier_suppression_field
        intensity = 0.5 * EPS0 * C * field**2 / 1e4
        axis.loglog(
            intensity, model.cycle_averaged_rate(field), color=COLOUR[name], label=name
        )
    axis.axvline(intensity[-1], color="#86b6ef", ls=":")
    axis.set_xlabel("intensity (W/cm$^2$)")
    axis.set_ylabel("cycle-averaged rate (1/s)")
    axis.set_title(f"{gas}, 800 nm (the forms: one electron)")
    axis.xaxis.set_minor_formatter(NullFormatter())
    axis.legend(fontsize=8)

nitrogen = orientation_averaged_rates("N2", "moadk_zhao_2010")
field = nitrogen.field / AU_FIELD
left = axes[1][0]
for k, angle in enumerate(nitrogen.angles):
    left.semilogy(
        field,
        nitrogen.resolved[k],
        color="#c3c2b7",
        marker=MARKERS[k],
        ms=4,
        lw=0.8,
        label=f"{angle:.0f} deg",
    )
left.semilogy(field, nitrogen.expected, color="#0b0b0b", lw=2, label="average")
dense = np.linspace(field[0], field[-1], 200)
with warnings.catch_warnings():
    # Drawn above the barrier-suppression field, to show how the forms fail.
    warnings.simplefilter("ignore", ModelRangeWarning)
    for name in STATIC:
        model = replace(
            molecular_rate_model("N2", np.inf, name), vibrational_constant=0.0
        )
        rate = model.instantaneous_rate(dense * AU_FIELD)
        left.semilogy(
            dense, rate / AU_ANGULAR_FREQUENCY, color=COLOUR[name], label=name
        )
left.set_xlabel("field (atomic units)")
left.set_ylabel("static rate (atomic units)")
left.set_title("N2: all electrons, by angle, and the static forms")
left.legend(fontsize=7, ncol=2)

for axis, gas in zip(axes[1][1:], ("N2", "CO", "H2"), strict=True):
    for name in STATIC:
        comparison = orientation_averaged_rates(gas, name)
        axis.plot(
            comparison.field / AU_FIELD,
            comparison.ratio,
            color=COLOUR[name],
            marker="o",
            ms=4,
            label=name,
        )
    barrier = molecular_rate_model(gas, np.inf, STATIC[0]).barrier_suppression_field
    axis.axvline(barrier / AU_FIELD, color="#86b6ef", ls=":")
    axis.axhline(1.0, color="#0b0b0b", lw=0.8)
    axis.set_xlabel("field (atomic units)")
    axis.set_ylabel("form / orientation-averaged reference")
    axis.set_title(f"{gas}: static forms over the reference")
    axis.legend(fontsize=8)
plt.show()
Total running time of the script: (0 minutes 2.292 seconds)