Note
Go to the end to download the full example code.
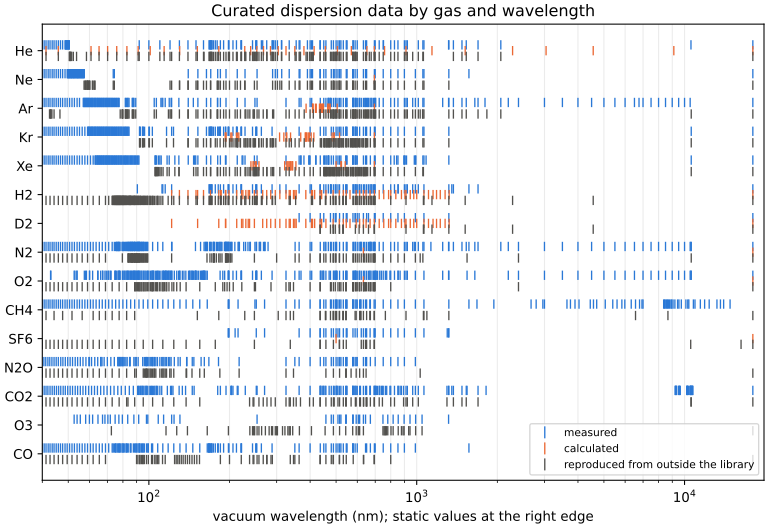
Wavelength coverage of the curated data#
One row per gas, one tick per curated value that bears on the linear dispersion, coloured by what it is: a source’s own measurement, a calculation, or a value reproduced from a source outside the library. Static values (the polarizability at zero frequency) sit at the right edge. The gaps are where new data would help most.
import matplotlib.pyplot as plt
import numpy as np

from optmat.datasets import datasets, sources
from optmat.gas.gases import Gas

KINDS = {
    "measurement": ("#2a78d6", "measured"),
    "theory": ("#eb6834", "calculated"),
    "reproduced": ("#52514e", "reproduced from outside the library"),
}
edge = 18e-6
fig, ax = plt.subplots(figsize=(8, 5.5), layout="constrained")
gases = list(Gas)
offsets = {"measurement": -0.2, "theory": 0.0, "reproduced": 0.2}
for row, gas in enumerate(gases):
    ticks = {key: [] for key in KINDS}
    for dataset in datasets(gas):
        if dataset.abscissa != "wavelength" or dataset.use in {"check", "excluded"}:
            continue
        wavelength = dataset.vacuum_wavelength()
        kind = sources()[dataset.source].kind
        key = "reproduced" if dataset.use == "reproduced" else kind
        ticks[key if key in KINDS else "measurement"].append(
            np.where(np.isinf(wavelength), edge, wavelength)
        )
    for key, shown in ticks.items():
        if not shown:
            continue
        # One tick per 1e-3 decade (a third of a pixel): the figure is unchanged, and
        # its SVG holds no tick drawn over another.
        position = np.unique(np.round(np.log10(np.concatenate(shown) * 1e9), 3))
        ax.plot(
            10**position,
            np.full(position.shape, row + offsets[key]),
            "|",
            color=KINDS[key][0],
            markersize=7,
        )
for colour, label in KINDS.values():
    ax.plot([], [], "|", color=colour, markersize=9, label=label)
ax.set_xscale("log")
ax.set_xlim(40, edge * 1.1e9)
ax.set_yticks(range(len(gases)), [g.value for g in gases])
ax.invert_yaxis()
ax.set_xlabel("vacuum wavelength (nm); static values at the right edge")
ax.grid(axis="x", which="both", alpha=0.25)
ax.legend(loc="lower right", fontsize=8)
ax.set_title("Curated dispersion data by gas and wavelength")
plt.show()
Total running time of the script: (0 minutes 2.587 seconds)