Note
Go to the end to download the full example code.
Raman: the response functions of the gases#
The gases’ Raman responses (optmat.gas.raman_response.raman_response()), at
295 K.
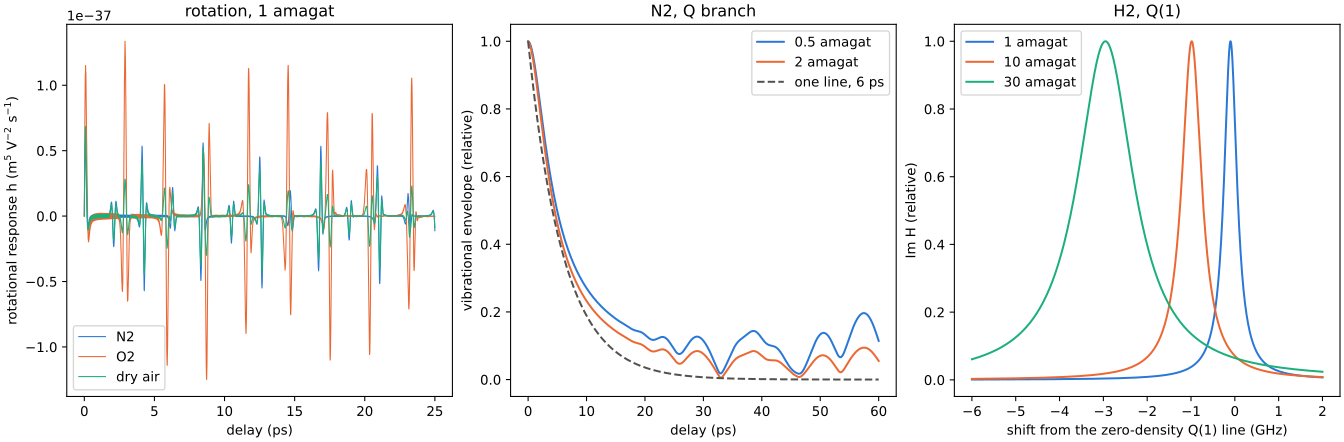
Left: the rotational response of N2, O2 and dry air at 1 amagat: the alignment in the first picoseconds and the revivals, every 8.4 ps for N2 and every 2.9 ps for O2, whose levels are all odd. Each line keeps its own width, so the revivals of air are the two gases’ in proportion.
Centre: the envelope of N2’s vibrational response at 0.5 and 2 amagat. Its Q(J) lines are spread below the band origin by the difference of the two levels’ rotational constants, so the lines’ sum first dephases on the branch’s approximately 6 ps envelope time (TC-491), and then persists at about a tenth, beating, until the collisional widths of the lines (some 100 ps at 1 amagat) damp it. Above 2 amagat the lines overlap and their mixing, not modelled, narrows the branch (TC-527, TC-688).
Right: H2’s gain, \(\mathrm{Im}\, H(\Omega)\), about the Q(1) line at 1, 10 and 30 amagat, against the shift from the zero-density line. The width is least near 2.4 amagat, where the Dicke narrowing and the collisional broadening balance, and 1.6 GHz at 30 amagat; the centre moves by -96 MHz/amagat (Bischel & Dyer’s Eq. (4), TC-688).
import math
import warnings

import matplotlib.pyplot as plt
import numpy as np
from _helpers import COLOURS

from optmat.exceptions import ModelRangeWarning
from optmat.gas.linewidths import AMAGAT
from optmat.gas.raman_response import raman_response

warnings.simplefilter("ignore", ModelRangeWarning)
fig, axes = plt.subplots(1, 3, figsize=(14, 4.6), layout="constrained")

t = np.linspace(0.0, 25e-12, 25001)
for colour, gas in zip(COLOURS, ("N2", "O2", "dry air"), strict=False):
    response = raman_response(gas, 295.0)
    h = response.response(t, AMAGAT, "anisotropic")
    axes[0].plot(t * 1e12, h, color=colour, lw=0.8, label=gas)
axes[0].set_xlabel("delay (ps)")
axes[0].set_ylabel("rotational response h (m$^5$ V$^{-2}$ s$^{-1}$)")
axes[0].set_title("rotation, 1 amagat")
axes[0].legend()

nitrogen = raman_response("N2", 295.0)
q = np.array(nitrogen.branch) == "Q"
t = np.linspace(0.0, 60e-12, 3001)
for colour, amagat in zip(COLOURS, (0.5, 2.0), strict=False):
    density = amagat * AMAGAT
    omega = nitrogen.frequencies(density)[q]
    rate = nitrogen.decay_rates(density)[q]
    amplitude = nitrogen.amplitude[q]
    # The envelope: the modulus of the lines' complex sum, about the band origin.
    centre = float(omega[np.argmax(amplitude)])
    envelope = np.abs(
        np.sum(
            amplitude * np.exp(1j * (omega - centre) * t[:, None] - rate * t[:, None]),
            axis=1,
        )
    )
    axes[1].plot(
        t * 1e12, envelope / envelope[0], color=colour, label=f"{amagat:g} amagat"
    )
axes[1].plot(
    t * 1e12, np.exp(-t / 6e-12), color="#52514e", ls="--", label="one line, 6 ps"
)
axes[1].set_xlabel("delay (ps)")
axes[1].set_ylabel("vibrational envelope (relative)")
axes[1].set_title("N2, Q branch")
axes[1].legend()

hydrogen = raman_response("H2", 295.0)
line = int(np.flatnonzero((np.array(hydrogen.branch) == "Q") & (hydrogen.j == 1))[0])
centre = hydrogen.frequency[line]
detuning = np.linspace(-6e9, 2e9, 4001)  # Hz
for colour, amagat in zip(COLOURS, (1.0, 10.0, 30.0), strict=False):
    gain = np.imag(hydrogen.spectrum(centre + 2 * math.pi * detuning, amagat * AMAGAT))
    axes[2].plot(
        detuning / 1e9, gain / gain.max(), color=colour, label=f"{amagat:g} amagat"
    )
axes[2].set_xlabel("shift from the zero-density Q(1) line (GHz)")
axes[2].set_ylabel("Im H (relative)")
axes[2].set_title("H2, Q(1)")
axes[2].legend()
plt.show()
Total running time of the script: (0 minutes 0.877 seconds)