Note
Go to the end to download the full example code.
Group-velocity dispersion: the fits against the formulas in use#
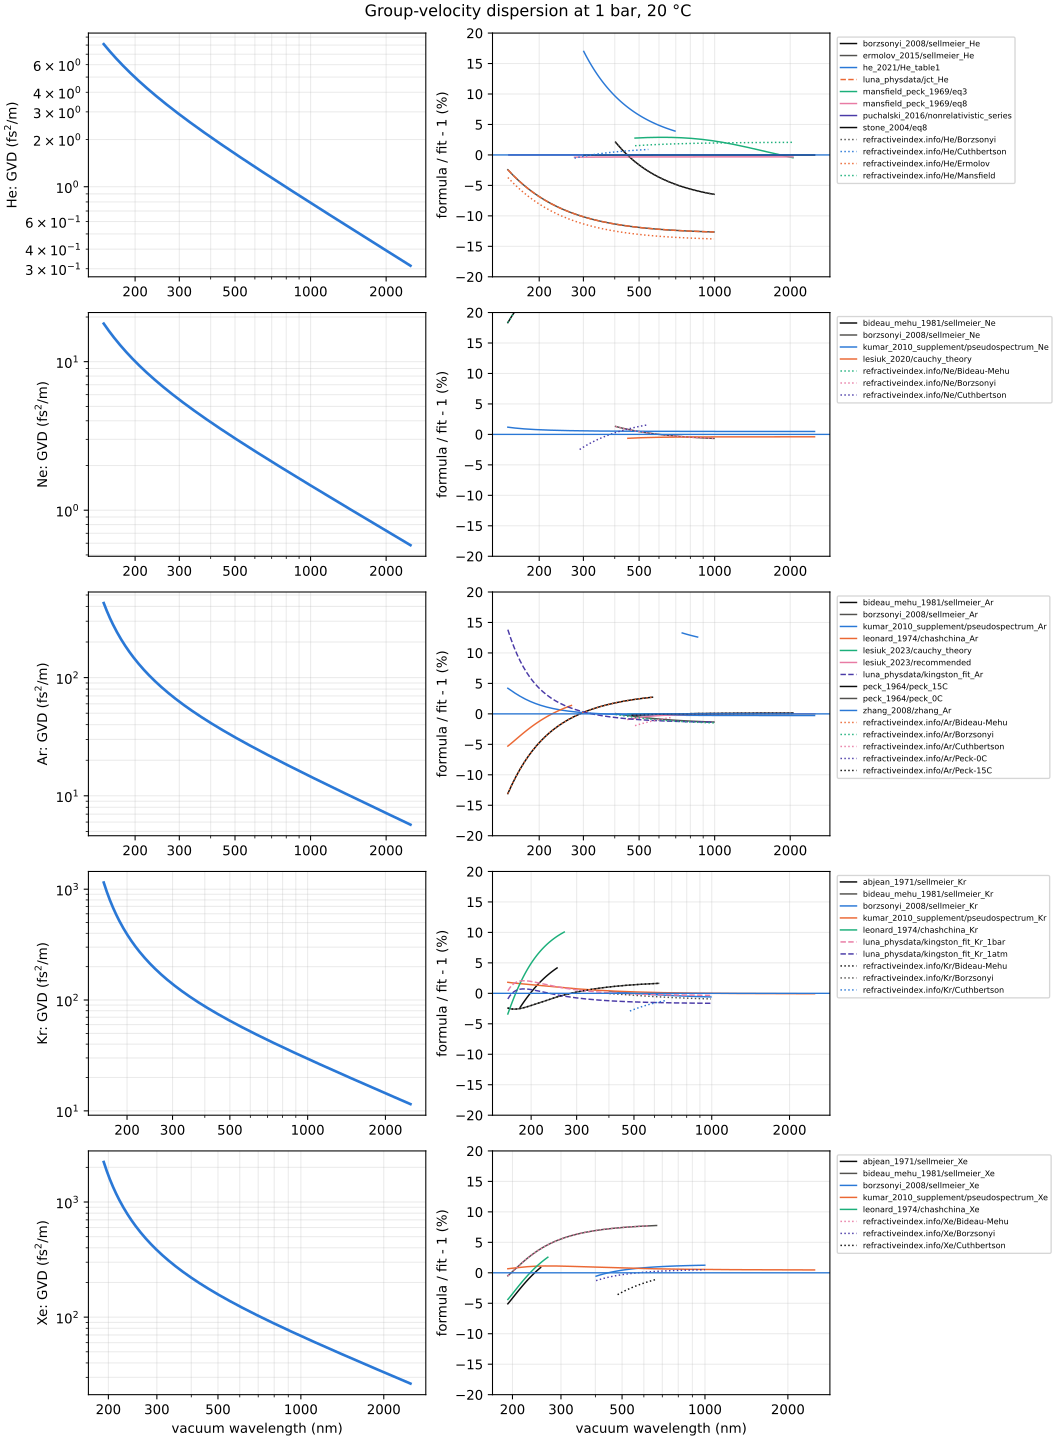
The group-velocity dispersion \(\beta_2 = (\lambda^3/2\pi c^2)\,\mathrm{d}^2n/\mathrm{d}\lambda^2\) of each noble gas at 1 bar and 20 °C, from the fitted model, and the ratio to it of every published, legacy and comparison formula over its stated range. The dispersion of a gas-filled hollow fibre is the gas’s \(\beta_2\) against the waveguide’s anomalous term, so these ratios move zero-dispersion wavelengths and phase-matching points directly.
For helium the fit reproduces the ab initio dispersion (Puchalski et al.; Stone & Stejskal’s formula agrees to 1e-5). The recorded Ermolov formula gives about 12 % less dispersion in the visible and near infrared; Börzsönyi’s differs by +2 % at 400 nm and -6 % at 800 nm. Each curve is labelled by its model identifier.
import warnings

import matplotlib.pyplot as plt
import numpy as np

from optmat.conditions import State
from optmat.constants import C
from optmat.exceptions import ModelRangeWarning
from optmat.gas.comparison import database_models
from optmat.gas.models.fitted import fitted_models
from optmat.gas.models.formulas import published_models

STATE = State(1e5, 293.15)
LINES = ["#0b0b0b", "#52514e", "#2a78d6", "#eb6834", "#1baf7a", "#e87ba4", "#4a3aa7"]


def gvd(model, wavelength):
    """Return beta_2 in fs^2/m by a central second difference in wavelength."""
    step = wavelength * 1e-3
    with warnings.catch_warnings():
        warnings.simplefilter("ignore", ModelRangeWarning)
        n = [model.refractivity(wavelength + k * step, STATE) for k in (-1, 0, 1)]
    second = (n[0] - 2 * n[1] + n[2]) / step**2
    return wavelength**3 / (2 * np.pi * C**2) * second * 1e30


gases = ["He", "Ne", "Ar", "Kr", "Xe"]
fig, axes = plt.subplots(len(gases), 2, figsize=(11, 15), layout="constrained")
for row, gas in enumerate(gases):
    fit = fitted_models()[f"fit/{gas}"]
    grid = np.geomspace(max(fit.wavelength_range[0] * 1.3, 150e-9), 2.5e-6, 300)
    reference = gvd(fit, grid)
    axes[row, 0].plot(grid * 1e9, reference, color="#2a78d6", linewidth=2, label="fit")
    others = [m for m in published_models().values() if m.gas == gas]
    others += [m for m in database_models().values() if m.gas == gas]
    for number, model in enumerate(others):
        low, high = model.wavelength_range
        inside = (grid >= low) & (grid <= high)
        if np.count_nonzero(inside) < 3:
            continue
        ratio = gvd(model, grid[inside]) / reference[inside]
        style = {
            "color": LINES[number % len(LINES)],
            "linestyle": {"comparison": ":", "legacy": "--"}.get(model.kind, "-"),
            "linewidth": 1.1,
        }
        axes[row, 1].plot(
            grid[inside] * 1e9, (ratio - 1) * 100, label=model.name, **style
        )
    axes[row, 0].set_ylabel(f"{gas}: GVD (fs$^2$/m)")
    axes[row, 1].set_ylabel("formula / fit - 1 (%)")
    axes[row, 1].axhline(0, color="#2a78d6", linewidth=1)
    axes[row, 1].set_ylim(-20, 20)
    axes[row, 1].legend(fontsize=6, loc="upper left", bbox_to_anchor=(1.01, 1.0))
    for axis in axes[row]:
        axis.set_xscale("log")
        ticks = [200, 300, 500, 1000, 2000]
        axis.set_xticks(ticks, [str(t) for t in ticks])
        axis.xaxis.set_minor_formatter(plt.NullFormatter())
        axis.grid(which="both", alpha=0.25)
    axes[row, 0].set_yscale("log")
axes[-1, 0].set_xlabel("vacuum wavelength (nm)")
axes[-1, 1].set_xlabel("vacuum wavelength (nm)")
fig.suptitle("Group-velocity dispersion at 1 bar, 20 °C")
plt.show()
Total running time of the script: (0 minutes 2.306 seconds)