Note
Go to the end to download the full example code.
Cross-checks: phase-matching ratios and group-delay dispersion#
Two kinds of measurement constrain dispersion without giving a refractive index
(optmat.gas.crosschecks). Shelton’s phase-matching density ratios tie the
near-infrared dispersion \(\alpha(2\omega) - \alpha(\omega)\) of two gases
together to about 0.1 %; Börzsönyi et al. measured the group-delay dispersion at 800 nm.
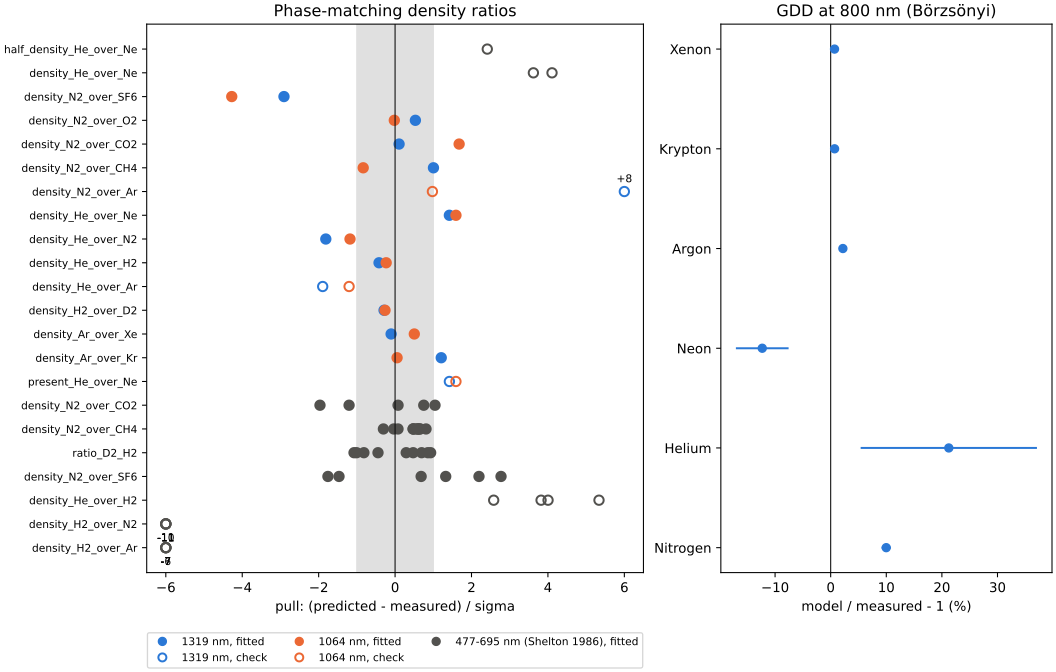
The left panel is the pull (prediction minus measurement, in the measurement’s standard uncertainty) of every ratio, from the recommended models of both gases. Filled markers are fitted by the model of one of the two gases (TC-96); open markers are checks. The N2/Ar ratio is a check because fitting it pulls nitrogen onto argon’s model, whose He/Ar ratio is 0.3 % below Shelton’s. The SF6 and CH4 formulas lack the infrared vibrational term that the difference of polarizabilities needs (TC-98): their pulls, off the scale, are printed at the edge.
The right panel is the relative deviation of the models’ group-delay dispersion from Börzsönyi’s (validators; TC-97).
import warnings

import matplotlib.pyplot as plt
import numpy as np

from optmat.exceptions import ModelRangeWarning
from optmat.gas.crosschecks import group_delay_dispersions, phase_match_ratios
from optmat.gas.fitting import FIT_DIRECTORY, load_config

with warnings.catch_warnings():
    warnings.simplefilter("ignore", ModelRangeWarning)
    ratios = phase_match_ratios()
    gdds = group_delay_dispersions()
fitted = {
    options.key
    for path in sorted(FIT_DIRECTORY.glob("*.toml"))
    for options in load_config(path.stem).fitted
}

LIMIT = 6.0
COLOURS = {1319: "#2a78d6", 1064: "#eb6834"}
fig, (left, right) = plt.subplots(
    1, 2, figsize=(11, 7), layout="constrained", width_ratios=(3, 2)
)
labels = sorted({c.key for c in ratios})
for y, key in enumerate(labels):
    for c in (c for c in ratios if c.key == key):
        pull = (c.predicted - c.measured) / c.sigma
        colour = COLOURS.get(round(c.wavelength * 1e9), "#52514e")
        face = colour if key in fitted else "none"
        shown = float(np.clip(pull, -LIMIT, LIMIT))
        left.plot(shown, y, "o", ms=7, mfc=face, mec=colour, mew=1.5)
        if abs(pull) > LIMIT:
            above = colour == COLOURS[1319]
            left.annotate(
                f"{pull:+.0f}",
                (shown, y),
                xytext=(0, 7 if above else -13),
                textcoords="offset points",
                ha="center",
                fontsize=8,
            )
left.set_yticks(range(len(labels)), [k.split("/")[1] for k in labels], fontsize=8)
left.axvline(0, color="#0b0b0b", lw=0.8)
left.axvspan(-1, 1, color="#e0e0e0", zorder=0)
left.set_xlim(-LIMIT - 0.5, LIMIT + 0.5)
left.set_xlabel("pull: (predicted - measured) / sigma")
left.set_title("Phase-matching density ratios")
for wavelength, colour in COLOURS.items():
    left.plot([], [], "o", mfc=colour, mec=colour, label=f"{wavelength} nm, fitted")
    check = f"{wavelength} nm, check"
    left.plot([], [], "o", mfc="none", mec=colour, mew=1.5, label=check)
left.plot([], [], "o", color="#52514e", label="477-695 nm (Shelton 1986), fitted")
left.legend(loc="upper center", bbox_to_anchor=(0.5, -0.1), ncol=3, fontsize=8)

names = [c.row for c in gdds]
deviation = np.array([c.deviation for c in gdds]) * 100
sigma = np.array([c.sigma / c.measured for c in gdds]) * 100
right.errorbar(deviation, range(len(gdds)), xerr=sigma, fmt="o", color="#2a78d6")
right.set_yticks(range(len(gdds)), names)
right.axvline(0, color="#0b0b0b", lw=0.8)
right.set_xlabel("model / measured - 1 (%)")
right.set_title("GDD at 800 nm (Börzsönyi)")
plt.show()
Total running time of the script: (0 minutes 4.380 seconds)