Note
Go to the end to download the full example code.
The compact models against their parents#
Each molecule’s compact model (OEP 2) keeps its fit’s electronic terms and replaces its vibrational poles, thousands of them for CO2 and N2O, by three to five effective ones. Top: the reduction’s residuals, compact minus parent, in units of the parent’s statistical one-sigma, for the polarizability and the dispersion derivatives \(D_m = d^m(\omega\alpha)/d\omega^m\) (\(D_2\) drives the group-velocity dispersion, \(D_3\) the third-order dispersion), over each compact model’s interval. The tolerance is 0.1 (dashed). Bottom: the infrared terms’ share of \(D_2\), which the compact poles have to carry: below 0.1 % in the ultraviolet, 1-17 % at 800 nm, and at the long-wavelength end more than the electronic part, so that \(\beta_2\) changes sign inside the interval of every molecule but CH4 (CO at 1969 nm, CO2 at 1315 nm, N2O at 1465 nm, SF6 at 1271 nm), where the share diverges.
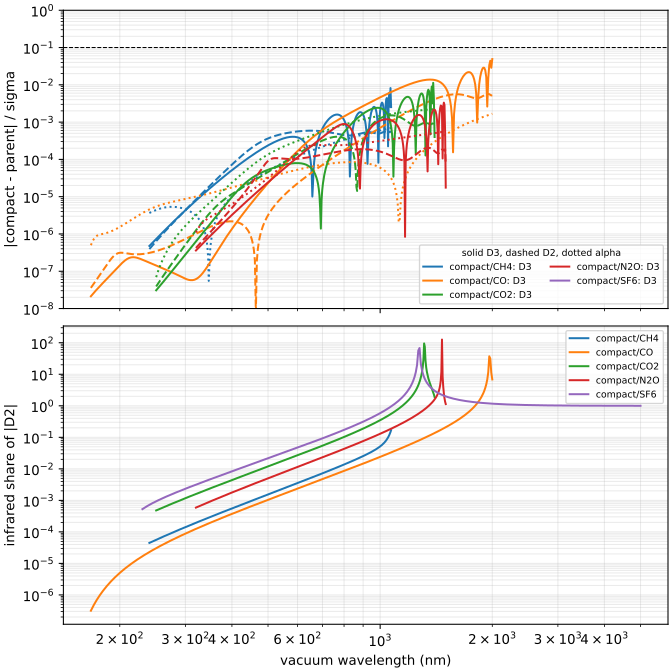
compact/CH4    943 -> 5 poles; worst |D3| residual 0.008 sigma
compact/CO      96 -> 3 poles; worst |D3| residual 0.049 sigma
compact/CO2   4187 -> 5 poles; worst |D3| residual 0.011 sigma
compact/N2O   6059 -> 5 poles; worst |D3| residual 0.003 sigma
compact/SF6      3 -> 3 poles; worst |D3| residual 0.000 sigma
import matplotlib.pyplot as plt
import numpy as np

from optmat.gas.fitting import HARTREE_NM
from optmat.gas.models.compact import (
    compact_models,
    pole_dispersion_au,
    residuals_sigma,
    vibrational_terms,
)
from optmat.gas.models.fitted import fitted_models

fig, (top, bottom) = plt.subplots(
    2, 1, figsize=(7, 7), sharex=True, layout="constrained"
)
for colour, (name, compact) in enumerate(sorted(compact_models().items())):
    parent = fitted_models()[compact.parent]
    (low, high), *_ = compact.intervals
    wavelength = np.geomspace(low, high, 400)
    omega = HARTREE_NM * 1e-9 / wavelength
    residuals = residuals_sigma(
        parent,
        compact.intervals,
        compact.record["strengths"],  # pyright: ignore[reportArgumentType]
        compact.record["energies_hartree"],  # pyright: ignore[reportArgumentType]
        400,
    )
    for key, style in (("alpha", ":"), ("D2", "--"), ("D3", "-")):
        top.semilogy(
            wavelength * 1e9,
            np.abs(residuals[key]) + 1e-12,
            style,
            color=f"C{colour}",
            label=f"{name}: {key}" if key == "D3" else None,
        )
    f, e = vibrational_terms(parent)
    infrared = pole_dispersion_au(f, e, omega, 2).sum(axis=0)
    share = np.abs(infrared / parent.dispersion_au(omega, 2))
    bottom.loglog(wavelength * 1e9, share, color=f"C{colour}", label=name)
    print(
        f"{name:12s} {len(f):5d} -> {len(compact.record['strengths'])} poles; "  # pyright: ignore[reportArgumentType]
        f"worst |D3| residual {np.max(np.abs(residuals['D3'])):.3f} sigma"
    )
top.axhline(0.1, color="k", linestyle="--", linewidth=0.8)
top.set_ylim(1e-8, 1)
top.set_ylabel("|compact - parent| / sigma")
top.legend(
    fontsize=7, ncol=2, title="solid D3, dashed D2, dotted alpha", title_fontsize=7
)
bottom.set_ylabel("infrared share of |D2|")
bottom.set_xlabel("vacuum wavelength (nm)")
bottom.legend(fontsize=7)
for axis in (top, bottom):
    axis.grid(which="both", alpha=0.25)
plt.show()
Total running time of the script: (0 minutes 3.161 seconds)