Note
Go to the end to download the full example code.
Helium in the extreme ultraviolet#
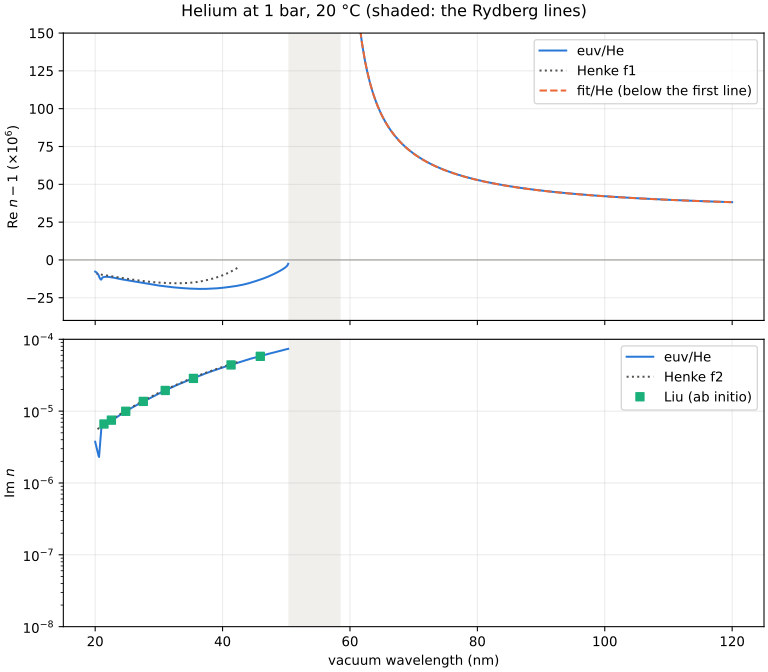
The complex refractive index of helium at 1 bar and 20 °C from 20 to 120 nm, from its
constrained oscillator-strength distribution (euv/He): Samson et al.’s measured
photoionisation cross section, Henke’s scattering factors above 120 eV and the NIST
Rydberg lines. Above the ionisation threshold (50.4 nm) \(\mathrm{Re}\,n - 1\) is
negative and the absorption index \(\mathrm{Im}\,n\) appears; between the first
line (58.4 nm) and the threshold the Rydberg lines make the index singular. For
comparison: the index from Henke’s \(f_1\) and \(f_2\) (dotted, unreliable below
about 30 eV by Henke et al.’s own account), Liu’s ab initio absorption (squares) and the
ab initio fit fit/He below the first resonance (dashed).
/home/docs/checkouts/optmat/checkouts/7/src/optmat/gas/models/base.py:439: ModelRangeWarning: fit/He (He) evaluated outside 60-inf nm, the range its source supports
  alpha = self.polarizability(wavelength, warn=warn)
import matplotlib.pyplot as plt
import numpy as np

from optmat.conditions import State
from optmat.constants import AU_POLARIZABILITY, EPS0
from optmat.datasets import DATA_DIRECTORY, datasets
from optmat.gas.eos import number_density
from optmat.gas.euv import EV_PER_HARTREE, euv_model
from optmat.gas.models.fitted import fitted_models

state = State(1e5, 293.15)
model = euv_model("He")
wavelength = np.concatenate(
    [np.linspace(20e-9, 50.3e-9, 400), np.linspace(58.6e-9, 120e-9, 300)]
)
n = model.refractive_index(wavelength, state)
# Break the curves across the Rydberg lines rather than joining them.
gap = np.searchsorted(wavelength, 55e-9)
wavelength = np.insert(wavelength, gap, np.nan)
n = np.insert(n, gap, np.nan)
density = number_density("He", state)

henke = np.loadtxt(DATA_DIRECTORY / "external" / "henke" / "he.nff", skiprows=1)
keep = (henke[:, 0] > 10.4) & (henke[:, 1] > -9000)
henke_wavelength = 1239.84198e-9 / henke[keep, 0]
omega = henke[keep, 0] / EV_PER_HARTREE
# Henke's n = 1 - delta - i beta; in the package's convention (Im n > 0 absorbs)
# alpha = -(f1 - i f2) / omega^2.
alpha = -(henke[keep, 1] - 1j * henke[keep, 2]) / omega**2 * AU_POLARIZABILITY
henke_n = 1 + density * alpha / (2 * EPS0)
inside = (henke_wavelength > 20e-9) & (henke_wavelength < 120e-9)

(liu,) = [d for d in datasets("He") if d.key == "liu_1997/alpha_imaginary"]
liu_omega = np.array([float(x) for x in liu.abscissae]) / EV_PER_HARTREE
liu_wavelength = 45.56335e-9 / liu_omega
liu_im_n = density * liu.scaled_values() * AU_POLARIZABILITY / (2 * EPS0)

fit = fitted_models()["fit/He"]
long = np.linspace(60e-9, 120e-9, 100)

fig, (top, bottom) = plt.subplots(
    2, 1, sharex=True, figsize=(8, 7), layout="constrained"
)
top.plot(wavelength * 1e9, (n.real - 1) * 1e6, color="#2a78d6", label="euv/He")
top.plot(
    henke_wavelength[inside] * 1e9,
    (henke_n.real[inside] - 1) * 1e6,
    ":",
    color="#52514e",
    label="Henke f1",
)
top.plot(
    long * 1e9,
    fit.refractivity(long, state) * 1e6,
    "--",
    color="#eb6834",
    label="fit/He (below the first line)",
)
top.axhline(0, color="#9a9994", linewidth=0.8)
top.set_ylim(-40, 150)
top.set_ylabel(r"Re $n - 1$ ($\times 10^{6}$)")
top.legend()
bottom.semilogy(
    wavelength * 1e9, np.maximum(n.imag, 1e-12), color="#2a78d6", label="euv/He"
)
bottom.semilogy(
    henke_wavelength[inside] * 1e9,
    henke_n.imag[inside],
    ":",
    color="#52514e",
    label="Henke f2",
)
bottom.semilogy(
    liu_wavelength * 1e9, liu_im_n, "s", color="#1baf7a", label="Liu (ab initio)"
)
bottom.set_ylim(1e-8, 1e-4)
bottom.set_ylabel(r"Im $n$")
bottom.set_xlabel("vacuum wavelength (nm)")
bottom.legend()
for axis in (top, bottom):
    axis.axvspan(50.43, 58.43, color="#f0efec", zorder=0)
    axis.grid(alpha=0.25)
fig.suptitle("Helium at 1 bar, 20 °C (shaded: the Rydberg lines)")
plt.show()
Total running time of the script: (0 minutes 0.543 seconds)