Noble-gas ionisation: measured yields#
A measured yield tests a rate together with the pulse, focal averaging and intensity calibration. Read Noble-gas ionisation: rate theory and Noble-gas ionisation: one-electron calculations before interpreting these ratios. The conclusions and outstanding uncertainties are collected in Noble-gas ionisation: accuracy and limitations.
Measured yields#
Four measurements have an intensity scale that does not rest on a rate model: two of them below, and Nie et al.’s and Nambu et al.’s further down.
Wahlstrand et al. (2018): the absolute yield of a 42 fs pulse at 800 nm, from the refractive index of the plasma, with the intensity known to 13 % (a factor of 1.9 in the yield).
Gas |
I (TW/cm2) |
gamma |
Measured yield |
|
|
|
|
|---|---|---|---|---|---|---|---|
Ar |
45 |
1.71 |
6.45e-05 |
1.20 |
1.73 |
0.67 |
0.63 |
Ar |
65 |
1.43 |
4.23e-04 |
2.07 |
2.87 |
1.52 |
1.33 |
Ar |
94 |
1.19 |
2.78e-03 |
2.84 |
3.79 |
2.73 |
2.28 |
Ar |
135 |
0.99 |
1.83e-02 |
3.02 |
3.85 |
3.72 |
3.02 |
Kr |
35 |
1.83 |
3.58e-04 |
1.36 |
1.65 |
0.54 |
0.64 |
Kr |
50 |
1.52 |
1.81e-03 |
2.41 |
2.75 |
1.28 |
1.42 |
Kr |
73 |
1.27 |
9.18e-03 |
3.45 |
3.74 |
2.45 |
2.56 |
Kr |
105 |
1.06 |
4.65e-02 |
3.76 |
3.88 |
3.52 |
3.53 |
Xe |
18 |
2.37 |
1.63e-04 |
2.90 |
4.21 |
0.64 |
1.15 |
Xe |
29 |
1.86 |
1.37e-03 |
5.16 |
6.69 |
1.75 |
2.84 |
Xe |
48 |
1.46 |
1.15e-02 |
6.75 |
7.86 |
3.59 |
5.24 |
Xe |
78 |
1.14 |
9.72e-02 |
5.05 |
5.30 |
4.29 |
5.38 |
Wallace et al. (2016): the yield of a 5.5 fs pulse at 800 nm on a free scale, with the intensity fixed by the yield of atomic hydrogen to 1.3 % (Ar), 1.5 % (Kr) and 2.5 % (Xe). What the measurement tests is where the yield bends towards saturation: the table gives the factor by which the measurement’s intensities must be multiplied for the model’s focal-averaged yield to have the measured dependence on intensity. One per cent is about 5 % in the rate.
Gas |
Calibration |
|
|
|
|
|
|---|---|---|---|---|---|---|
Ar |
1.3 % |
1.03 |
0.98 |
0.97 |
1.16 |
1.18 |
Kr |
1.5 % |
1.02 |
1.00 |
0.95 |
1.09 |
1.08 |
Xe |
2.5 % |
1.03 |
1.00 |
0.92 |
1.05 |
0.98 |
The shape of that measured dependence is the authors’ fit function, two of whose three
parameters were fitted to their own calculation. For krypton their supplement
tabulates the 37 measured points themselves, with their errors
(measured_points_test()). Each model is
fitted to them with its amplitude free; the scale is that of the least \(\chi^2\), and
the spread is the root mean square of model over measurement less 1:
Model |
Scale |
chi2 at it |
chi2 at a scale of 1 |
Spread |
|---|---|---|---|---|
|
1.02 |
269 |
301 |
3.7 % |
|
1.01 |
282 |
286 |
3.8 % |
|
0.96 |
279 |
444 |
3.8 % |
|
1.01 |
616 |
630 |
7.3 % |
|
1.01 |
561 |
577 |
6.8 % |
The printed errors (0.9 to 2.7 %) are smaller than the scatter of the points about any smooth curve: the authors’ own fit function has \(\chi^2 = 369\) for the 37 points. The default fits them better than that function does, at the measurement’s own intensities. The forms of the literature fit at nearly the same scale but with twice the \(\chi^2\): with the amplitude free, the points test the shape of the yield’s dependence on intensity more sharply than its position (TC-672).
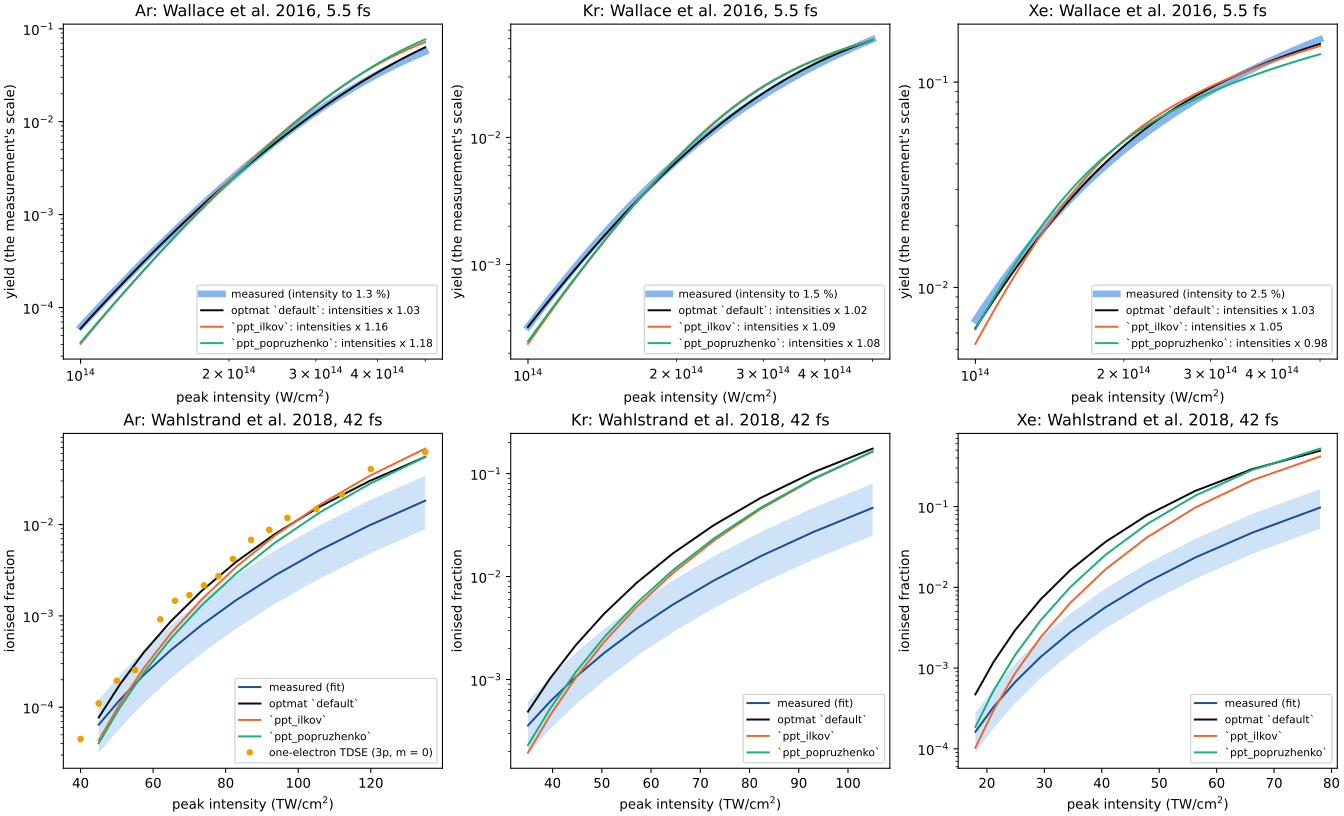
The default model against the measured yields of argon, krypton and xenon.#
Nie et al. (2022) and Nambu et al. (2026): the absolute ionisation of He, Ar, Kr,
Xe and H2 by 55 fs pulses at 800 nm and of Ar, Kr, Xe by 130 fs pulses at 400 nm,
linear and circular polarisation, measured as the phase a probe picks up from the
electrons left behind (normalised to 1 atm), read from their figures (TC-817, TC-818).
The intensities come from the measured energy, duration and spot size, with no stated
uncertainty. phase_shift_test predicts the phase from a rate: the ionised fraction
at each point of the Gaussian focus, averaged over the probe’s profile and integrated
along the axis (plasma_phase_shift, the papers’ Eq. 3), and fits the scale on the
measurement’s intensities, in linear polarisation and, with the rate below, circular:
Dataset |
nm |
Polarisation |
I (W/cm2) |
scale: |
|
|
|
|
|---|---|---|---|---|---|---|---|---|
|
400 |
circular |
3.24e+13 to 2.59e+14 |
0.97 |
0.73 |
1.22 |
1.17 |
1.09 (0.74 to 1.66) |
|
400 |
linear |
3.24e+13 to 2.27e+14 |
0.90 |
0.67 |
1.08 |
1.05 |
1.44 (0.57 to 4.57) |
|
400 |
circular |
1.94e+13 to 2.27e+14 |
1.02 |
0.70 |
1.40 |
1.25 |
0.89 (0.63 to 1.31) |
|
400 |
linear |
1.30e+13 to 1.62e+14 |
1.00 |
0.69 |
1.31 |
1.19 |
1.03 (0.73 to 2.61) |
|
400 |
circular |
6.48e+12 to 9.71e+13 |
1.26 |
0.65 |
1.82 |
1.46 |
0.43 (0.15 to 0.75) |
|
400 |
linear |
4.53e+12 to 7.77e+13 |
0.98 |
0.50 |
1.41 |
1.13 |
1.07 (0.84 to 1.49) |
|
800 |
circular |
1.29e+14 to 3.86e+14 |
1.13 |
1.08 |
1.14 |
1.17 |
0.46 (0.24 to 0.85) |
|
800 |
linear |
6.43e+13 to 3.22e+14 |
1.06 |
1.01 |
1.09 |
1.11 |
0.64 (0.41 to 1.02) |
|
800 |
circular |
6.43e+13 to 3.86e+14 |
1.01 |
1.00 |
1.10 |
1.08 |
0.89 (0.49 to 1.35) |
|
800 |
linear |
6.43e+13 to 2.89e+14 |
0.97 |
0.95 |
1.00 |
0.99 |
1.08 (0.81 to 1.35) |
|
800 |
circular |
4.82e+13 to 2.57e+14 |
1.03 |
0.98 |
1.20 |
1.12 |
0.87 (0.61 to 1.12) |
|
800 |
linear |
3.22e+13 to 2.89e+14 |
0.92 |
0.89 |
1.04 |
0.96 |
1.14 (0.86 to 1.50) |
|
800 |
linear |
2.91e+14 to 7.28e+14 |
0.91 |
0.90 |
0.96 |
0.99 |
2.13 (1.73 to 2.55) |
|
800 |
circular |
1.09e+14 to 4.37e+14 |
1.03 |
0.98 |
1.03 |
1.06 |
0.84 (0.65 to 1.13) |
|
800 |
linear |
5.43e+13 to 3.64e+14 |
0.98 |
0.93 |
0.97 |
1.00 |
1.10 (0.79 to 1.63) |
|
800 |
circular |
7.28e+13 to 3.63e+14 |
0.91 |
0.90 |
1.00 |
0.98 |
1.53 (1.32 to 1.70) |
|
800 |
linear |
5.48e+13 to 3.27e+14 |
0.89 |
0.87 |
0.94 |
0.93 |
1.55 (1.29 to 1.87) |
|
800 |
circular |
3.95e+13 to 3.14e+14 |
0.85 |
0.81 |
1.00 |
0.93 |
1.92 (1.42 to 2.42) |
|
800 |
linear |
3.93e+13 to 2.75e+14 |
0.80 |
0.77 |
0.89 |
0.83 |
1.83 (1.38 to 2.73) |
|
800 |
linear |
6.01e+13 to 4.81e+14 |
0.85 |
2.05 (1.04 to 5.17) |
The following observations record the earlier static-factor comparison
(TC-817, TC-818, TC-820). The generated table above shows both default_static
and the current frequency-dependent default; use its labelled columns for the
current results.
At 800 nm the static-factor default matches Nambu et al., at intensity scales 1.01 (Ar), 0.96 (Kr) and 0.89 (Xe); the literature’s forms fit as well, so the measurement does not separate the Coulomb factors there.
Nambu et al.’s 800 nm points are Nie et al.’s, re-scaled: at equal phase their intensities are 0.88 to 0.89 times Nie et al.’s for Ar and Kr and 0.82 for Xe, which the paper does not explain (TC-818). Against Nie et al.’s intensities the static-factor default needs 0.93, 0.875 and 0.77.
At 400 nm the static-factor default is 3 to 5 times too high (Keldysh parameters 2 to 6), where Popruzhenko et al.’s factor fits within 5 to 19 % in the intensity. The static Coulomb factor’s excess at large Keldysh parameter has now four indications: the one-electron calculations (Noble-gas ionisation: one-electron calculations), the R-matrix rates and Parker et al.’s helium at 390 nm, and this measurement (TC-817).
Circular polarisation agrees with linear. With the rate of Circular polarisation below, the static-factor default fits Nambu et al.’s circular data at 1.08, 1.00 and 0.98 and Nie et al.’s at 0.98, 0.90 and 0.81, near the linear scales of the same measurements; at 400 nm it is 2.8 to 3.5 times too high in circular polarisation as in linear (TC-820).
Multiphoton saturation at 248.6 nm#
Uiterwaal et al. (1998) measured the saturation intensities of He, Ar and Kr in 500 fs
pulses at 248.6 nm from the ponderomotive shift of the photoelectrons, without an
intensity calibration: the peak intensity at which a single rate ionises \(1 - 1/e\) of
the atoms, so that the integral of the rate over the pulse is 1 there (their Eq. 9;
TC-853). At Keldysh parameters of 1.8 to 7 they test the rate where the calculations
of argon at 400 nm stop and the multiphoton regime begins. The wavelength is below
the models’ range (350 nm). The rate’s integral over their pulse at the measured
saturation intensity, and in brackets the model’s own saturation intensity over the
measured one (saturation_test()):
Gas |
gamma |
I_sat measured (W/cm2) |
|
|
|
|
|---|---|---|---|---|---|---|
He |
1.8 |
6.90e+14 (12 %) |
3.4 (0.71) |
5.7 (0.60) |
2.3 (0.79) |
1.6 (0.88) |
Ar |
3.7 |
1.00e+14 (15 %) |
4.3 (0.58) |
32 (0.21) |
4.5 (0.57) |
4.6 (0.61) |
Kr |
7.1 |
2.40e+13 (25 %) |
0.55 (1.26) |
13 (0.26) |
0.48 (1.33) |
0.53 (1.25) |
The frequency-dependent factor removes most of the static factor’s excess in the multiphoton regime: argon’s rate at its saturation intensity falls from 32 times to 4.3, krypton’s from 13 to 0.55, helium’s from 5.7 to 3.4.
What remains is a factor of 0.55 to 4.3, against the measurement’s 12 to 25 % in the intensity, a factor of 1.7 to 2 in the rate at these orders (N = 3 to 5): helium and argon are high by about twice that, krypton within it. At gamma = 7 the rate of a single resonance-free process is not what a cycle-averaged tunnelling formula is made for; neon, whose four-photon resonances make the single rate invalid, has no value.
The sum over channels matters here. The default replaces the sum over the number of photons absorbed by its integral (Noble-gas ionisation: rate theory, TC-654), which is smooth in the field but in the multiphoton regime gives the yield a non-integer order. With the sum (
channel_sum="sum") the default’s integral over Uiterwaal et al.’s pulse is 4.0 (He), 2.3 (Ar) and 1.2 (Kr) at their saturation intensities, against 3.4, 4.3 and 0.55 with the integral (TC-856).An all-electron cross section. McKenna & van der Hart’s (2004) R-matrix Floquet three-photon cross section of argon at 193 nm (6.42 eV, gamma 15 at their 1e13 W/cm2) is 6.43e-83 cm6 s2, on the rising wing of a 4p resonance. The default’s effective sigma_3 = W / Phi^3 is 1.5 times it at 1e13 W/cm2 and 12 times at 1e11 with the integral over the channels; with the sum 0.74 and 1.10, an I^3 law within 26 % of the calculation. The static Coulomb factor’s is 146 times at 1e13 (TC-856).
Circular polarisation#
IonisationRateModel.circular_rate gives the rate in a circularly polarised field of
magnitude \(F = (I/\varepsilon_0 c)^{1/2}\), constant within the cycle. Each
fine-structure channel’s static rate, as in linear polarisation, is multiplied by the
factor by which the field’s turning raises the shell’s short-range rate,
circular_enhancement: Barth & Smirnova’s (2013) rates of the \(p_+\), \(p_-\) and \(p_0\)
orbitals (the magnetic quantum number along the direction of propagation; the \(s\)
orbital for helium), summed, over their value at zero frequency. The factor tends to 1
in the adiabatic limit, so the static limit is the default’s; for argon at 800 nm and
2e14 W/cm² it is 3.7. The Coulomb factor enters as the model’s over its static limit,
as Nambu et al. do; its form in circular polarisation is not derived (TC-820).
The two measurements disagree, by a factor of about 3 in the rate where they meet. The default model needs intensity scales of 1.02 to 1.03 on Wallace et al.’s, just beyond their calibration, and lies 1.2 to 3.8 times above Wahlstrand et al.’s for argon and krypton (the static-factor default: 0.98 to 1.00, and 1.7 to 3.9); every form of the rate, the literature’s included, is above the latter at its higher intensities. One electron of argon in Wahlstrand et al.’s pulse, calculated, is already 1.3 to 4.1 times above their atom, with the excited states left out; neither the pulse’s duration nor Rydberg atoms explain the difference (TC-702). The disagreement is open (TC-660). Until it is resolved the default follows Wallace et al.’s measurement, whose intensities rest on atomic hydrogen, and is not adjusted towards Wahlstrand et al.’s (TC-814).
As intensity scales (the factor on a measurement’s intensities at which the static-factor default fits; TC-819):
Measurement |
Ar |
Kr |
Xe |
|---|---|---|---|
Wallace et al. 2016, 5.5 fs, intensity from atomic hydrogen |
0.98 |
1.00 |
1.00 |
Nambu et al. 2026, 55 fs |
1.01 |
0.96 |
0.89 |
Nie et al. 2022, 55 fs |
0.93 |
0.875 |
0.77 |
Wahlstrand et al. 2018, 42 fs |
0.84 |
0.82 |
0.69 |
The factor of 3 in the rate is 15 to 20 % in the intensity, the size of the change between one group’s two publications of its own data. Within each absolute measurement, where one calibration serves all three gases, xenon’s scale is 0.82 to 0.88 of argon’s: the default’s xenon is high against its argon by a factor of 2 to 3 in the rate, the spread of xenon’s structure coefficient (TC-657).